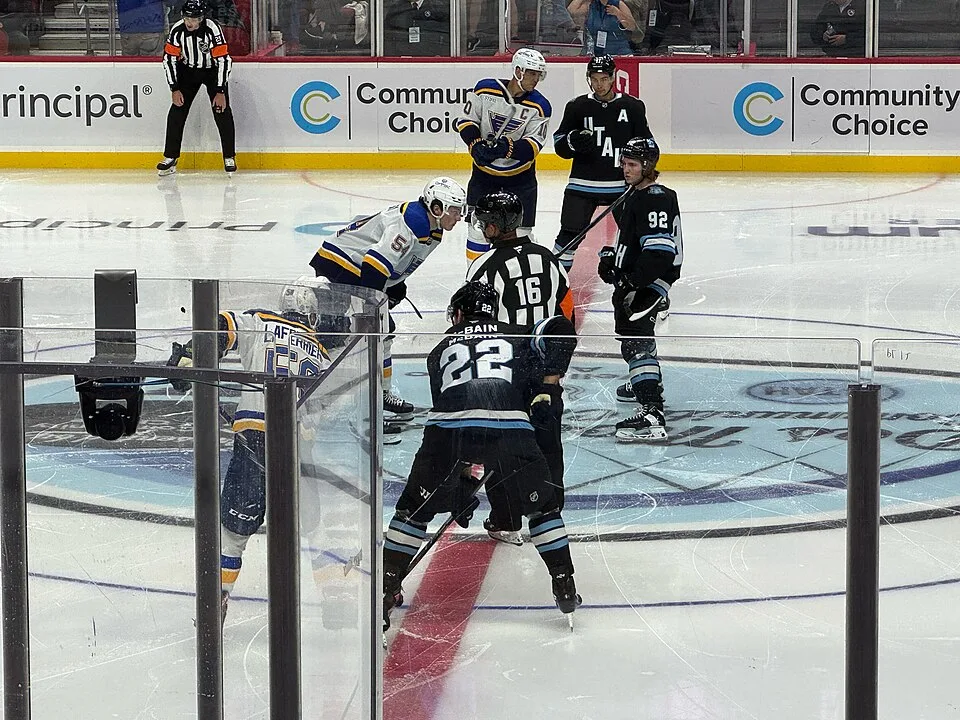
Times are Mountain. Home games at the Delta Center. Full schedule
Statistics
Skaters · 2026-27
Player
Pos
GP
G
A
Pts
+/-
Clayton Keller
R
11
4
10
14
-3
Nick Schmaltz
C
11
7
6
13
-6
Mikhail Sergachev
D
11
3
10
13
+3
Logan Cooley
C
11
3
8
11
-3
Dylan Guenther
R
11
4
5
9
-2
Barrett Hayton
C
11
1
6
7
+5
Kailer Yamamoto
R
6
2
4
6
+2
Vincent Trocheck
C
11
3
2
5
-4
Anders Lee
L
11
2
3
5
0
John Marino
D
9
2
3
5
+5
Kevin Stenlund
C
11
1
4
5
+3
Daniil But
L
11
2
2
4
+4
Goalies · 2026-27
Player
GP
W-L-OT
GAA
Sv%
Karel Vejmelka
9
5-3-0
3.04
.874
Sebastian Cossa
4
2-1-0
3.33
.820
Advanced stats
5-on-5 · 2026-27
Stat
Mammoth
NHL rank
Shot attempt share (Corsi)
57.3%
3 of 32
Unblocked shot share (Fenwick)
57.9%
3 of 32
Shot attempt share, close games
57.1%
5 of 32
Goal share
54.5%
11 of 32
Shooting percentage
9.1%
20 of 32
Save percentage
.894
22 of 32
PDO (shooting + save %)
98.5
22 of 32
Offensive zone starts
51.5%
13 of 32
All situations · 2026-27
Stat
Mammoth
NHL rank
Power play
38.5%
1 of 32
Penalty kill
66.7%
29 of 32
Faceoffs won
53.4%
6 of 32
Shots for per game
30.6
3 of 32
Shots against per game
22.7
3 of 32
Source: NHL.com stats. Shares are the Mammoth's portion of all attempts or goals while both teams have five skaters; above 50% means they out-shot or out-scored opponents. PDO adds shooting and save percentage; far above 100 often means luck that tends to even out. Expected goals, shot maps and history: Natural Stat Trick · MoneyPuck · Hockey-Reference.
Player analytics
Skaters at 5-on-5 · 2026-27 · on-ice shares, sorted by ice time
Player
Pos
GP
TOI/GP
CF%
Rel CF%
FF%
On-ice Sh%
On-ice Sv%
PDO
OZ start %
MacKenzie Weegar
D
11
18:08
57.4
+0.2
59.6
7.1
.871
94.2
44.4
John Marino
D
9
17:58
59.2
+4.4
60.1
11.9
.903
102.2
55.7
Nate Schmidt
D
11
17:40
59.8
+3.9
60.0
10.0
.892
99.2
52.5
Mikhail Sergachev
D
11
16:22
54.4
-4.5
57.7
11.1
.878
98.9
47.8
Dmitri Simashev
D
11
14:12
53.6
-5.0
52.4
7.4
.895
96.9
53.0
Andrew Peeke
D
11
14:07
57.3
+0.1
54.6
5.0
.925
97.5
60.8
Vincent Trocheck
C
11
13:25
56.4
-1.1
57.4
6.6
.887
95.3
58.8
Clayton Keller
R
11
13:15
58.9
+2.3
60.3
8.2
.857
93.9
68.8
Kailer Yamamoto
R
6
13:03
59.8
+4.1
61.8
11.6
.857
97.3
45.6
Nick Schmaltz
C
11
12:43
55.5
-2.2
57.5
9.7
.813
91.0
58.5
Lawson Crouse
L
11
12:35
57.9
+0.9
57.8
8.9
.893
98.2
46.1
Nick DeSimone
D
2
12:22
63.6
+2.7
64.7
18.1
.888
106.9
33.3
Logan Cooley
C
11
12:21
56.5
-0.9
55.0
9.5
.894
98.9
60.7
Dylan Guenther
R
11
12:17
58.1
+1.2
56.2
9.6
.907
100.3
60.6
Barrett Hayton
C
11
12:12
62.5
+7.1
62.6
8.9
.918
100.7
37.8
Anders Lee
L
11
11:47
61.4
+5.6
62.1
8.5
.857
94.2
57.6
Jack McBain
C
11
11:30
54.9
-3.0
54.7
8.1
.977
105.8
32.8
Kevin Stenlund
C
11
11:16
53.0
-5.4
53.8
11.5
.897
101.2
32.4
Michael Carcone
L
5
10:58
53.1
-5.9
55.4
8.0
.950
103.0
48.1
Daniil But
L
11
10:19
54.6
-3.3
56.6
9.6
.971
106.7
42.5
Skaters, all situations · 2026-27 · shot attempts, physical play and puck battles
Player
Pos
TOI/GP
Attempts
Missed
Blocked
Hits
Blocks
Take
Give
Mikhail Sergachev
D
23:04
61
8
24
6
12
5
15
MacKenzie Weegar
D
21:25
59
11
25
36
33
3
15
John Marino
D
20:23
19
5
6
2
4
2
17
Nate Schmidt
D
20:20
33
4
17
15
9
1
9
Nick Schmaltz
C
18:14
43
7
4
9
4
4
11
Logan Cooley
C
17:57
35
13
9
14
6
4
14
Clayton Keller
R
17:56
53
10
18
5
7
1
13
Dylan Guenther
R
16:45
81
24
25
5
4
2
12
Vincent Trocheck
C
16:26
33
11
6
34
6
2
6
Andrew Peeke
D
16:04
30
9
11
11
13
1
7
Dmitri Simashev
D
14:58
28
11
6
17
8
1
10
Lawson Crouse
L
14:47
34
8
7
31
7
2
5
Kailer Yamamoto
R
14:30
18
2
0
13
3
2
0
Barrett Hayton
C
13:58
45
12
13
3
9
3
9
Kevin Stenlund
C
13:48
23
5
9
10
8
2
12
Anders Lee
L
13:15
46
19
8
13
8
1
11
Nick DeSimone
D
13:01
4
1
1
1
0
0
1
Jack McBain
C
12:37
29
11
7
50
4
3
5
Michael Carcone
L
12:29
27
6
4
11
0
0
3
Daniil But
L
10:58
30
9
8
19
7
1
5
Goalies · 2026-27 · a quality start is a start with a save percentage above the league average, or at least .885 on 20 or fewer shots
Player
GP
GS
Quality starts
QS %
Shots against /60
GAA
Sv%
Karel Vejmelka
9
8
4
50.0
24.1
3.04
.874
Sebastian Cossa
4
3
1
33.3
18.5
3.33
.820
Source: NHL.com stats. CF% is the share of all shot attempts (shots, misses and blocked shots) taken by Mammoth players while he is on the ice at 5-on-5; FF% leaves out blocked shots. Rel CF% compares that share with how the team does when he is off the ice. On-ice Sh% and Sv% are the team's shooting and save percentages with him on the ice, and PDO adds the two. OZ start % is the share of his non-neutral faceoff starts in the offensive zone. In the all-situations table, Blocked counts his attempts blocked by opponents, Blocks the shots he blocked, and Take and Give his takeaways and giveaways. For expected goals, shot maps and line combinations, see Natural Stat Trick, MoneyPuck and Hockey-Reference's 2026-27 page.

 Utah Mammoth

 Utah Jazz →
 Real Salt Lake →